Instacart Seasonal Sales
Targeted market insights through regional observation of open source data.

Goals & Objective
Instacart is an online grocery store that operates through an app, already having very good sales, they want to uncover more information about their sales patterns. The task is to perform an initial data and exploratory analysis of some of their data in order to derive insights and suggest strategies for better segmentation based on the provided criteria.
Improve targeting for ad campaigns.
Know what part of what's being offered has the lowest market share and why. Based on this input, help to improve the sector and boost sales.
Target ads, promotions, and recommendations that are relevant to the products customers order regularly.
Tools
Microsoft Excel, Microsoft PowerPoint, Python, & Tableau Public
Key Questions
What’s the distribution among users in regards to their brand loyalty (i.e., how often do they return to Instacart)?
Are there differences in ordering habits based on a customer’s loyalty status?
Are there differences in ordering habits based on a customer’s region?
Is there a connection between age and family status in terms of ordering habits?
What different classifications does the demographic information suggest? Age? Income? Certain types of goods? Family status?
What differences can you find in the ordering habits of different customer profiles?
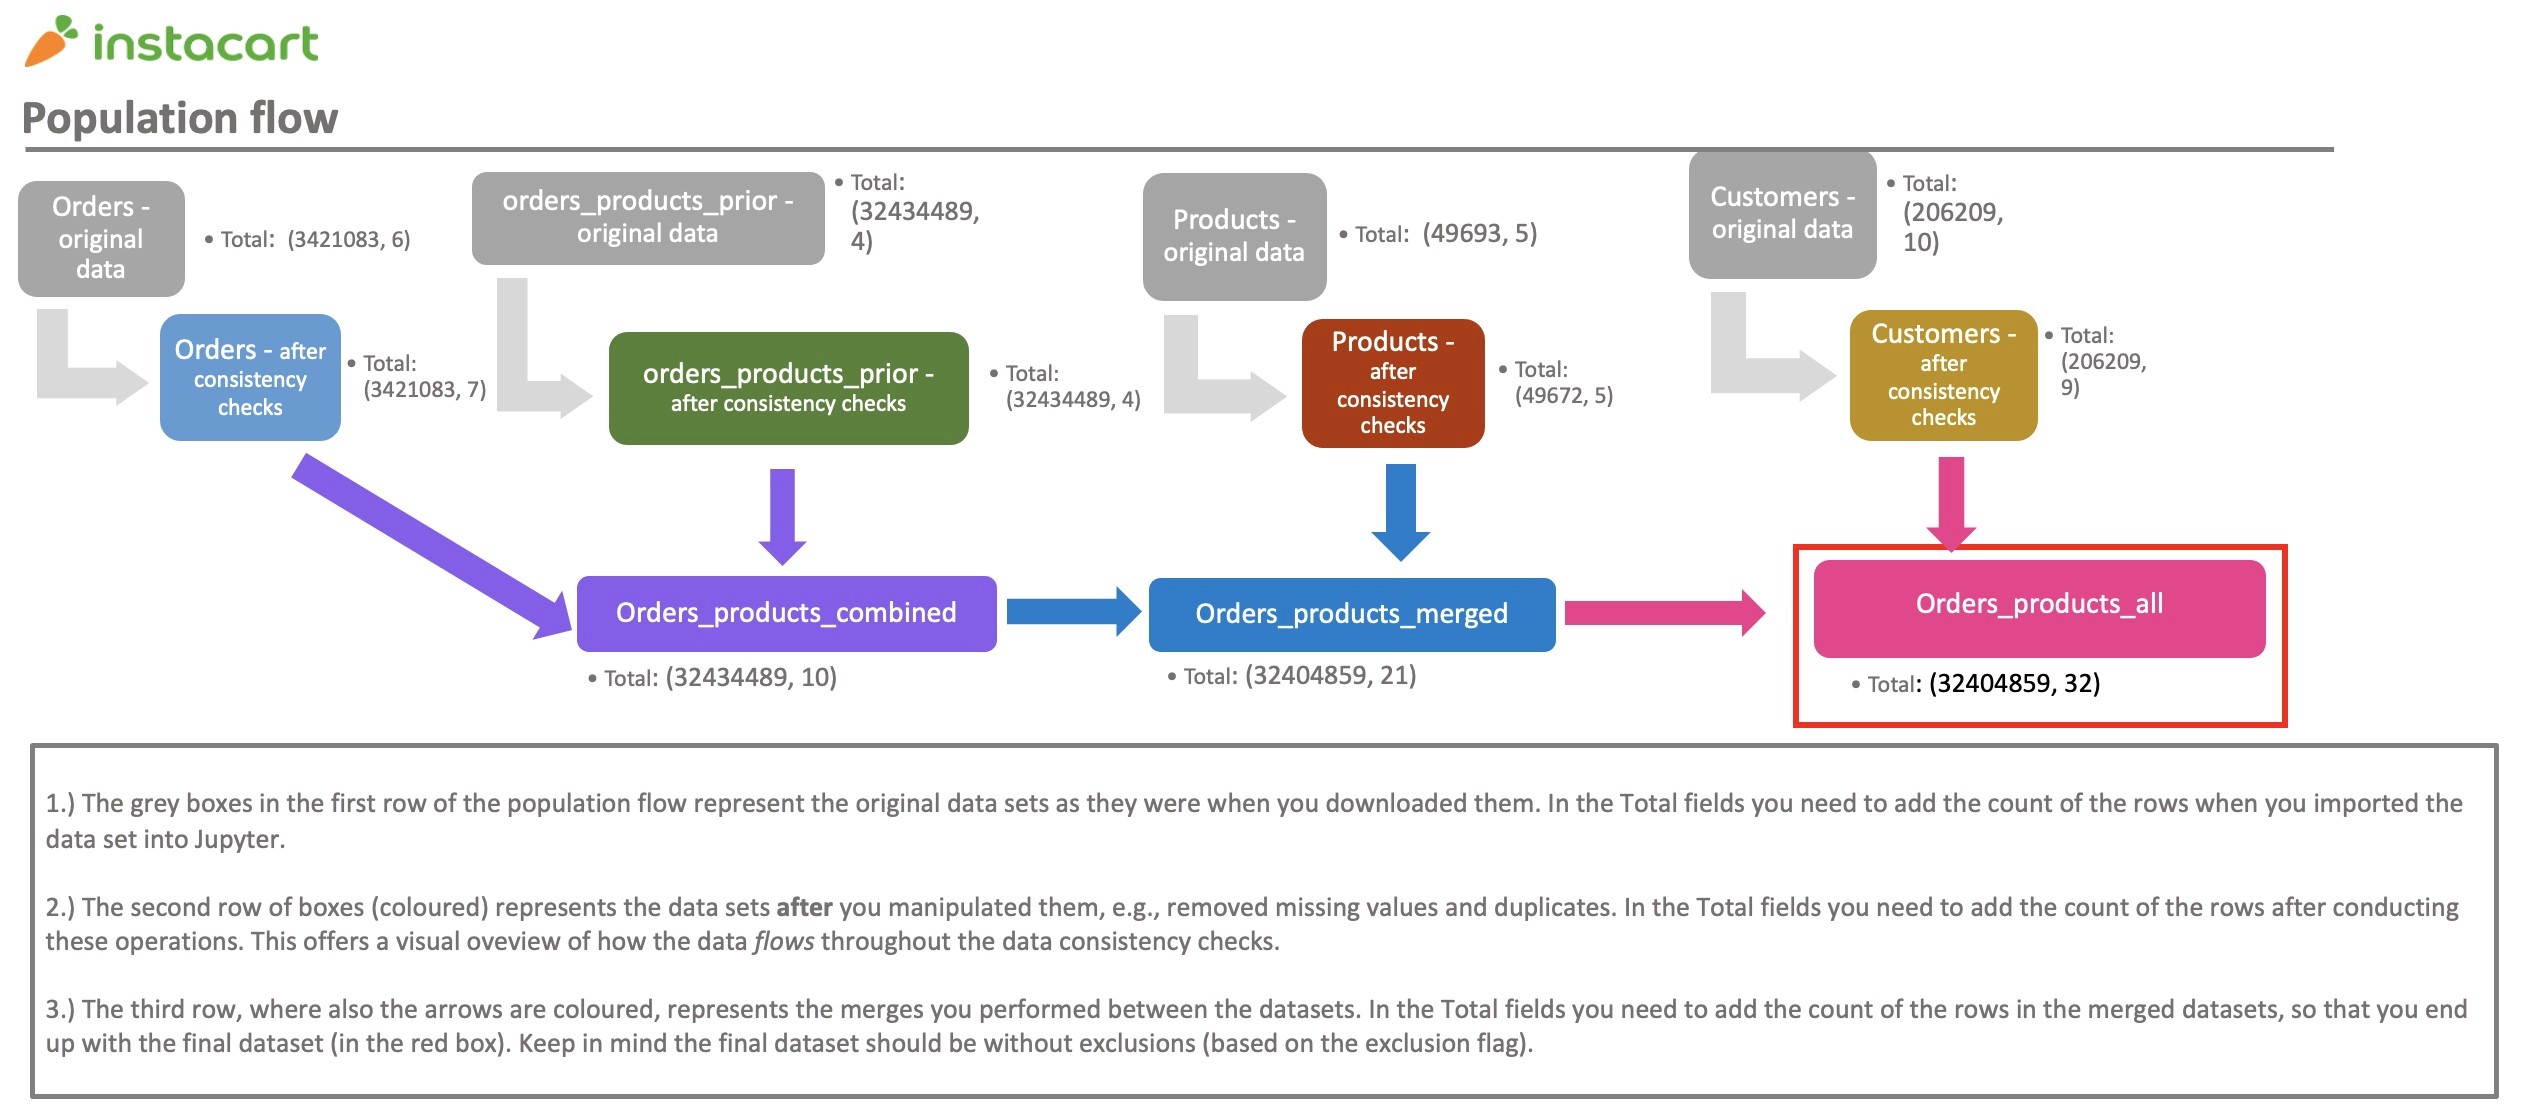
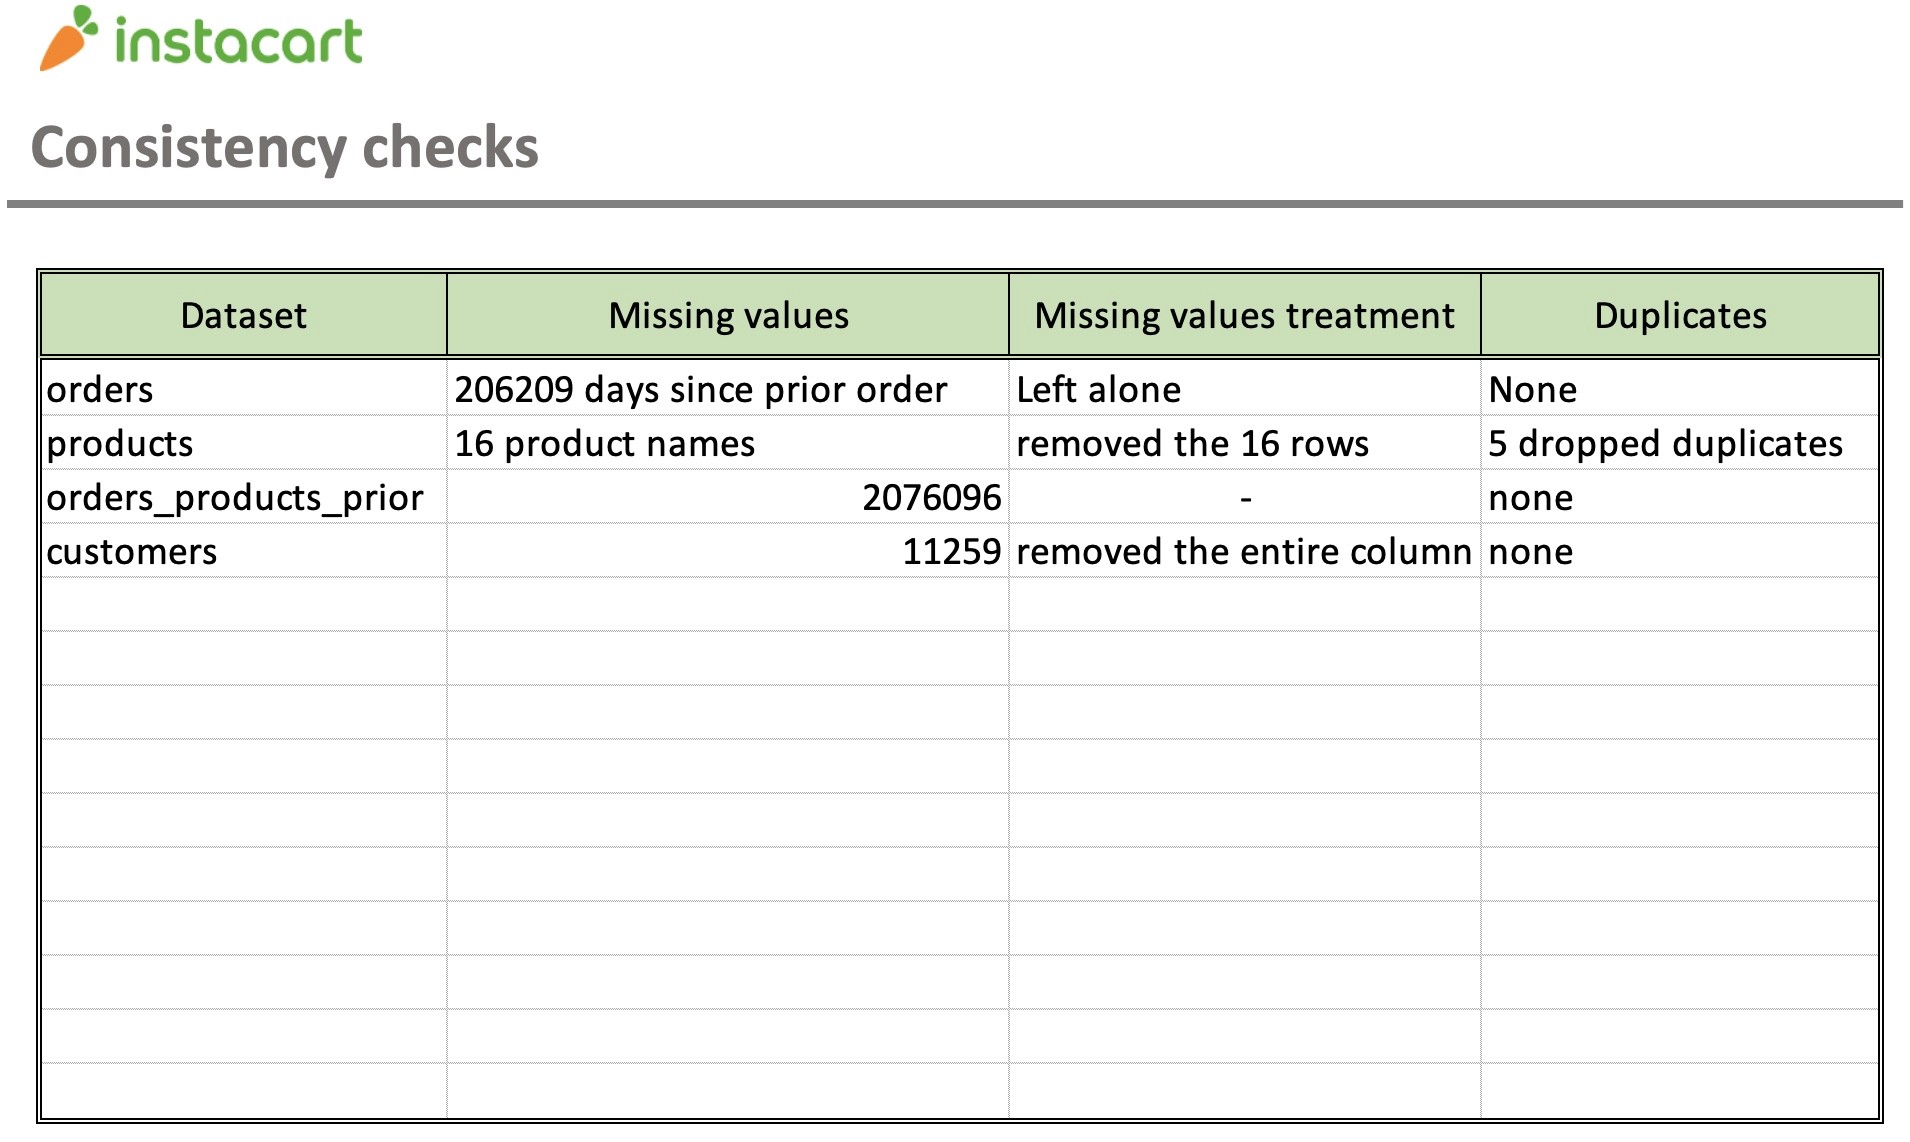
Consistency is essential when utilizing large amounts of data, and checking these values is a key part of every step in any analysis.
Maintaining notes before any project is of compounding importance. The more data made available, the more essential its organizing and notations is.
Having a better comprehension from data organizing, sometimes results in finding insights doing routine checks.
Take this Instacart project for example. Checking for missing values and duplicates helped see a trend in customer profile creation, meaning some individuals created a profile every time they used Instacart.
Brand Loyalty
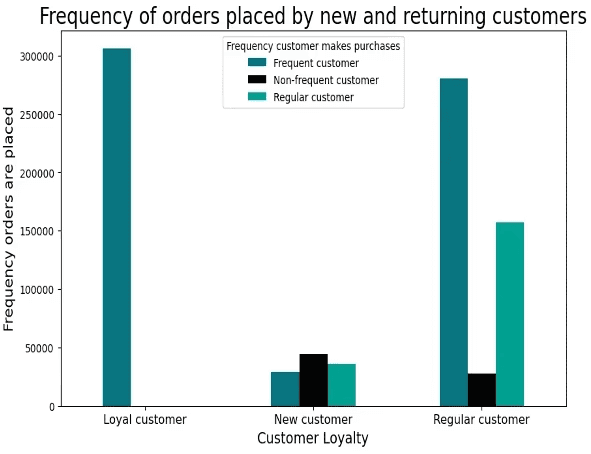
Overall loyal customers make up by a majority of frequent ordering. Regular customers make up the second largest margin of frequent orders, then new customers with inconsistent order frequency.
Loyalty Status
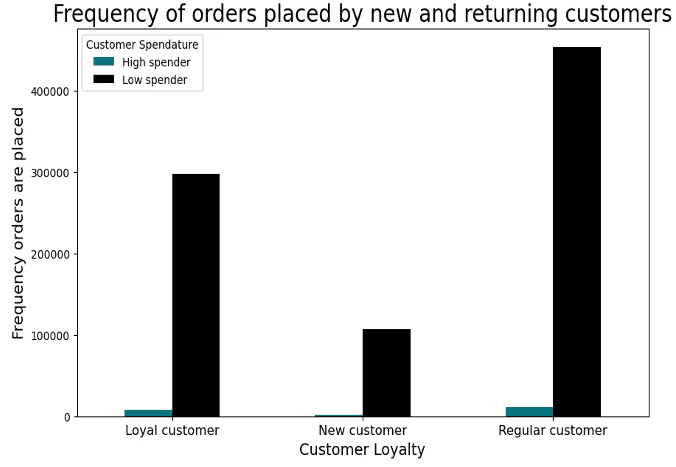
Customers that make regular purchases spend less but order more frequently while loyal customers make less purchases and still spend less. It's very infrequent for any customer to spend a lot on Instacart purchases.
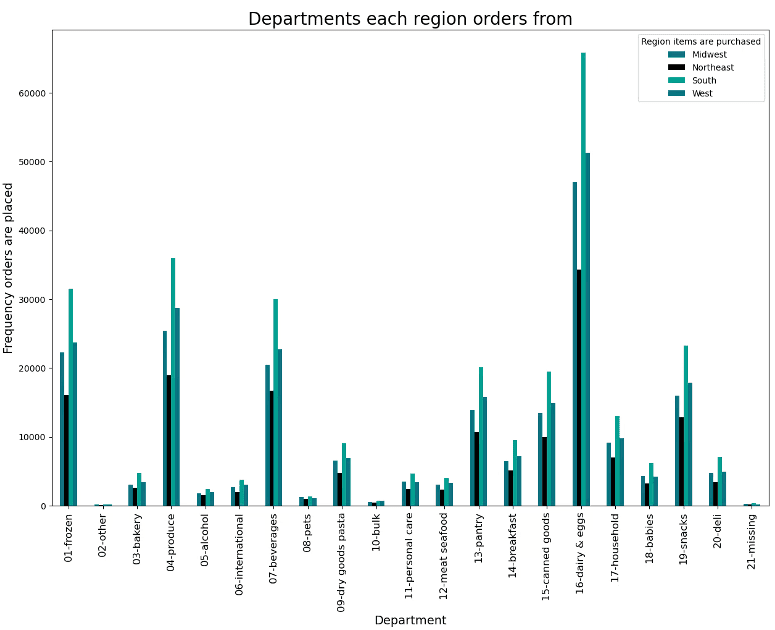
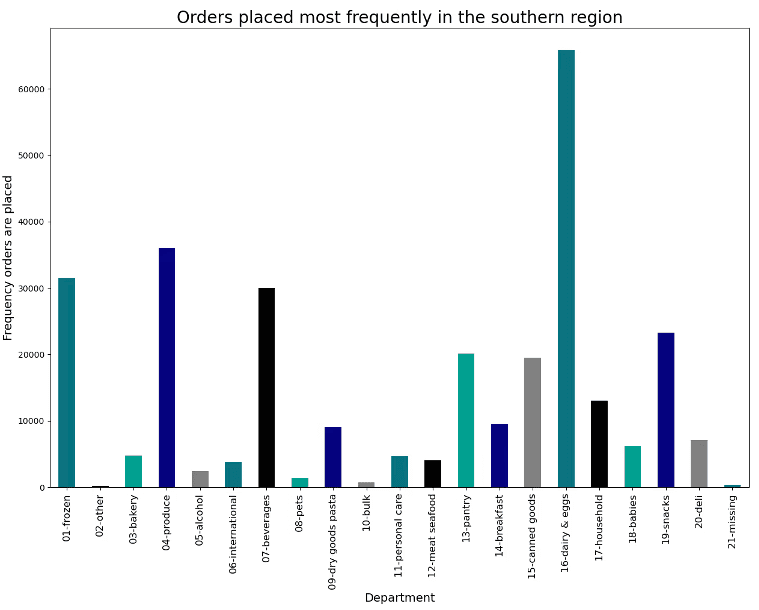
Customer Region
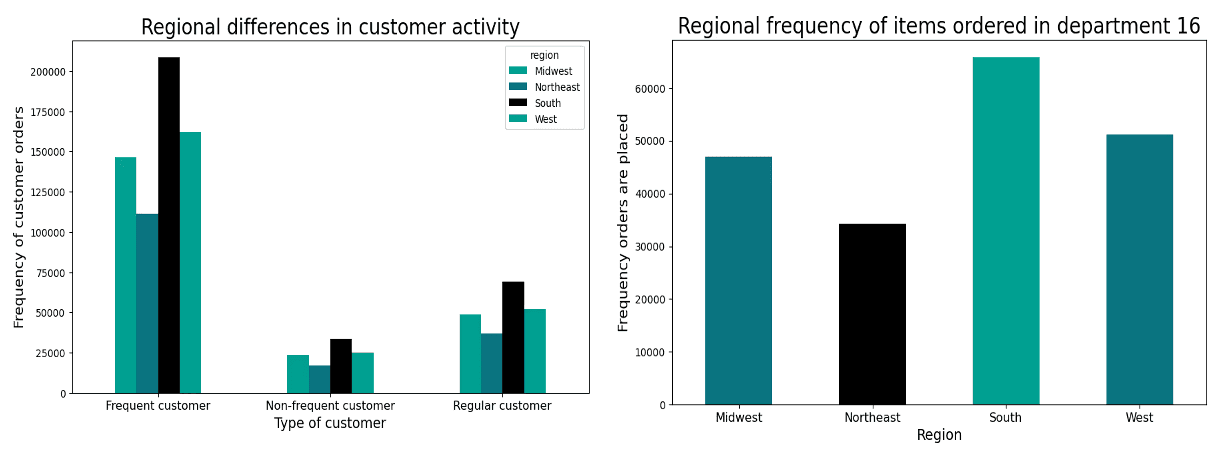
The users located in the southern regions tend to make more frequent purchases on eggs/dairy, beverages, frozen goods, and produce through Instacart than other regions do.
Age and Family
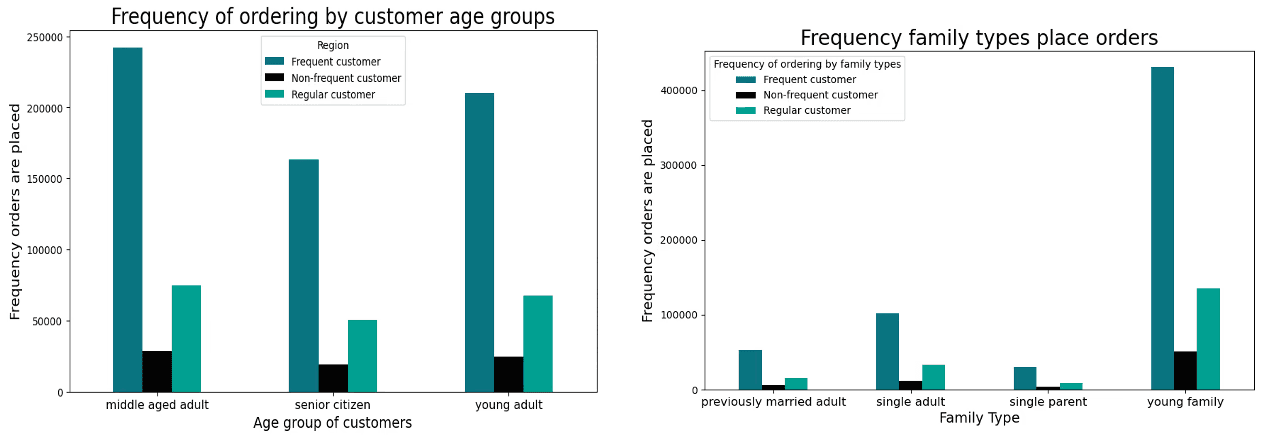
Families under 40 have the highest frequency of orders rather than single adults or other independent purchasers.
Demographic
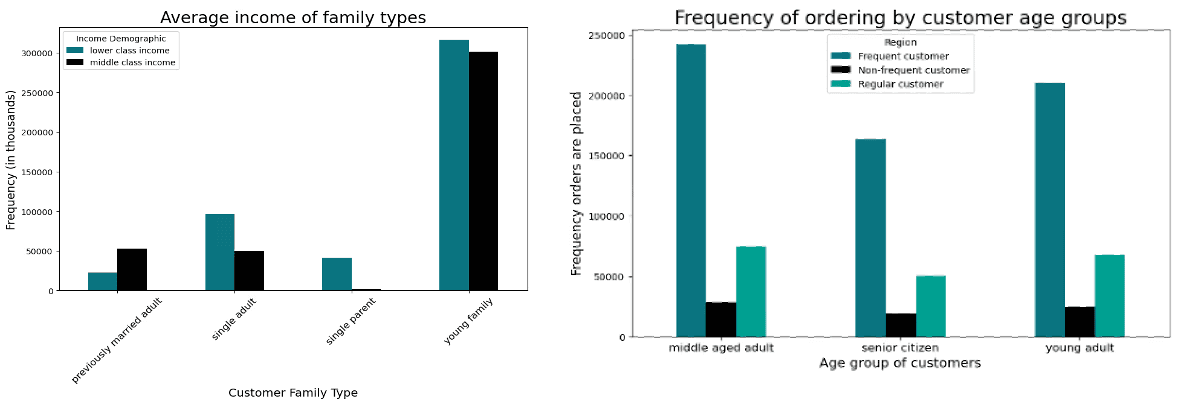
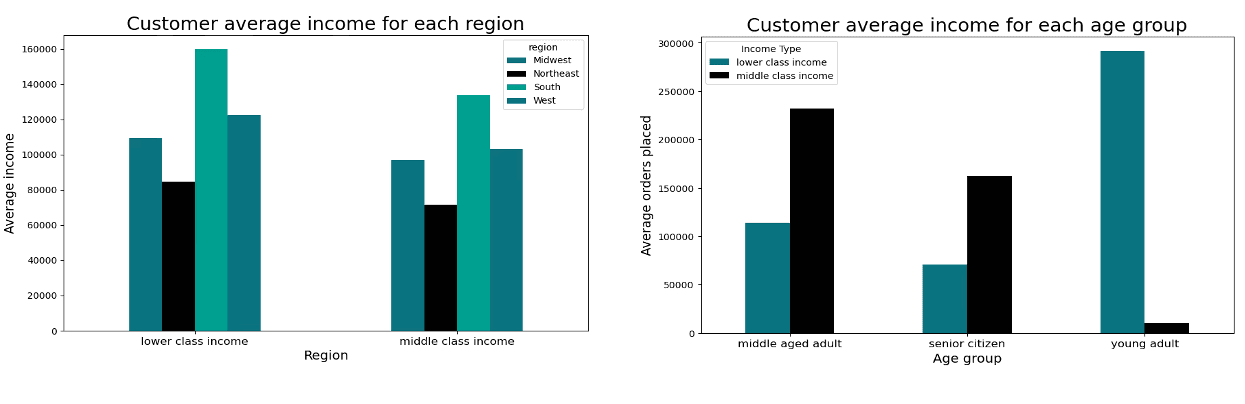
Age to determines senior citizens, middle aged and young adults. Income to determine lower and middle class income. Family status and the number of dependents to determines families make up the majority of all ordering.
Customer Profiles
Final Recommendations:
Market on Wednesdays and Thursdays when ordering is low, focusing on ads for meat/seafood with the highest pricing.
Primary focus should also be during the middle of the evening between 12 PM and 4 PM as it is when customers are likely to spend more.
Target product departments to advertise include: Frozen goods, produce, beverages, dairy/egg products, and snacks.
Concluding these results, refine the advertising for users who have dependants with low incomes. Orders are place more frequently in the south region, so increase ordering by advertising party combinations for regions like the northeast and the Midwest.
Data Resources
Follow this for the customer Dataset: Instacart customer dataset
Follow this for the original Dataset: Original Instacart dataset
Follow this for the full project: Instacart Githhub